A C+ Is the Best the Bay Has Ever Done
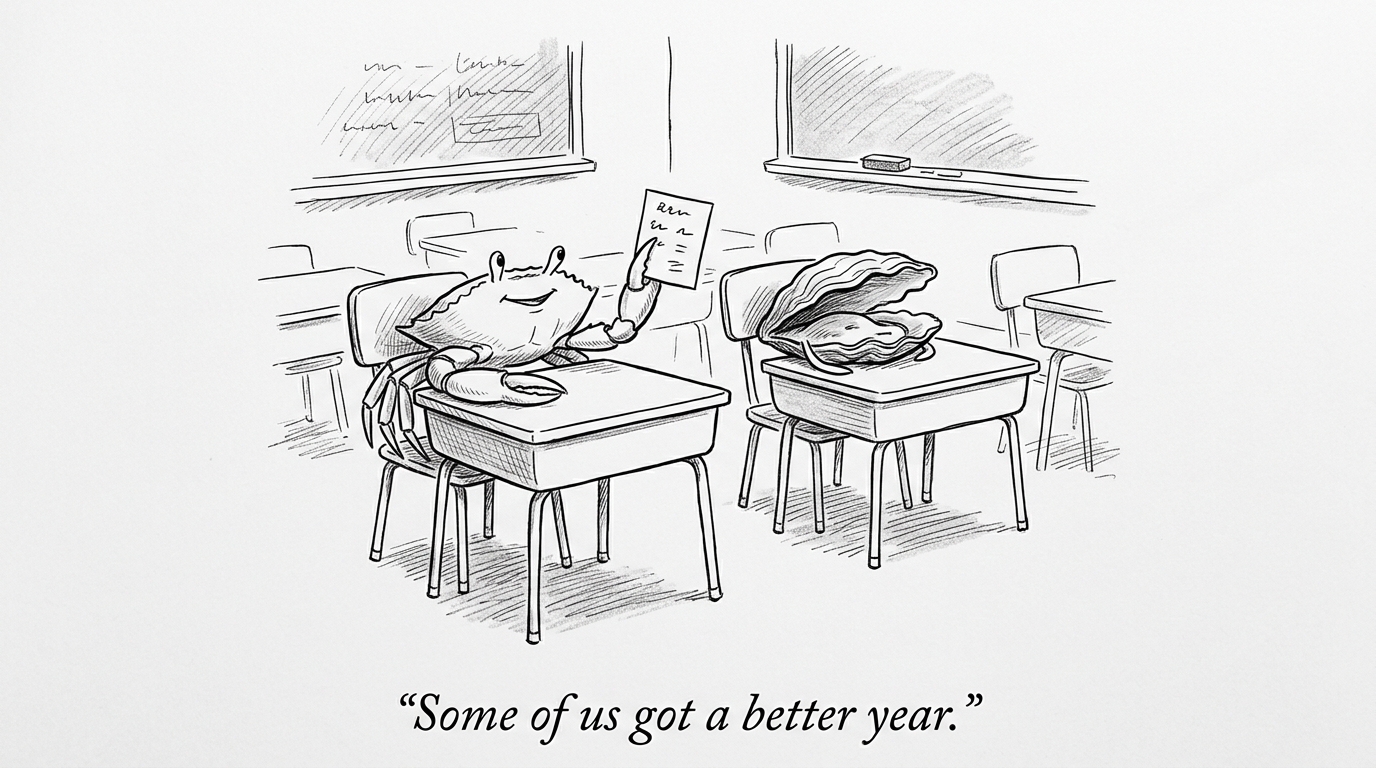
In October the University of Maryland Center for Environmental Science gave the Chesapeake Bay a C+, the best grade in the 40 years it has scored the Bay.[1][2] The grade measures water and grasses. It does not measure a crab pot or a sailboat, and the people who work and sail on the Bay had a year that does not line up with the grade.
What the grade says
The Bay scored 56 percent, a C+, and so did the watershed that drains into it.[1] About half of the 15 regions are improving, and the lower Bay, off Virginia, scored its best ever.[4] Underwater grasses, nitrogen and phosphorus all improved, and dissolved oxygen earned an A.[2][4][5] The people who follow the Bay credit decades of upgrades to wastewater plants, less fertilizer and stormwater runoff, and oyster restoration, plus favorable weather this year.[2][3][4]
The same report finds the water cloudier overall and harmful algal blooms, measured as chlorophyll a, trending worse.[4] The lower James River and the lower Eastern Shore of Maryland are getting worse over time. The Lower Western Shore scored lowest, a D-, and the Patuxent and the Patapsco and Back rivers also earned D's.[4][24] The best grade in 40 years is a C+ with bad corners.
The crab boat
Blue crabs are a large part of Maryland's waterfront economy. Maryland watermen landed about 23 million pounds in 2025, worth about $51 million at the dock.[6] In 2024 Maryland accounted for about 60 percent of the Bay's commercial crab harvest.[7] The dock price leaves out the picking houses, restaurants and festivals the crab feeds.[6]
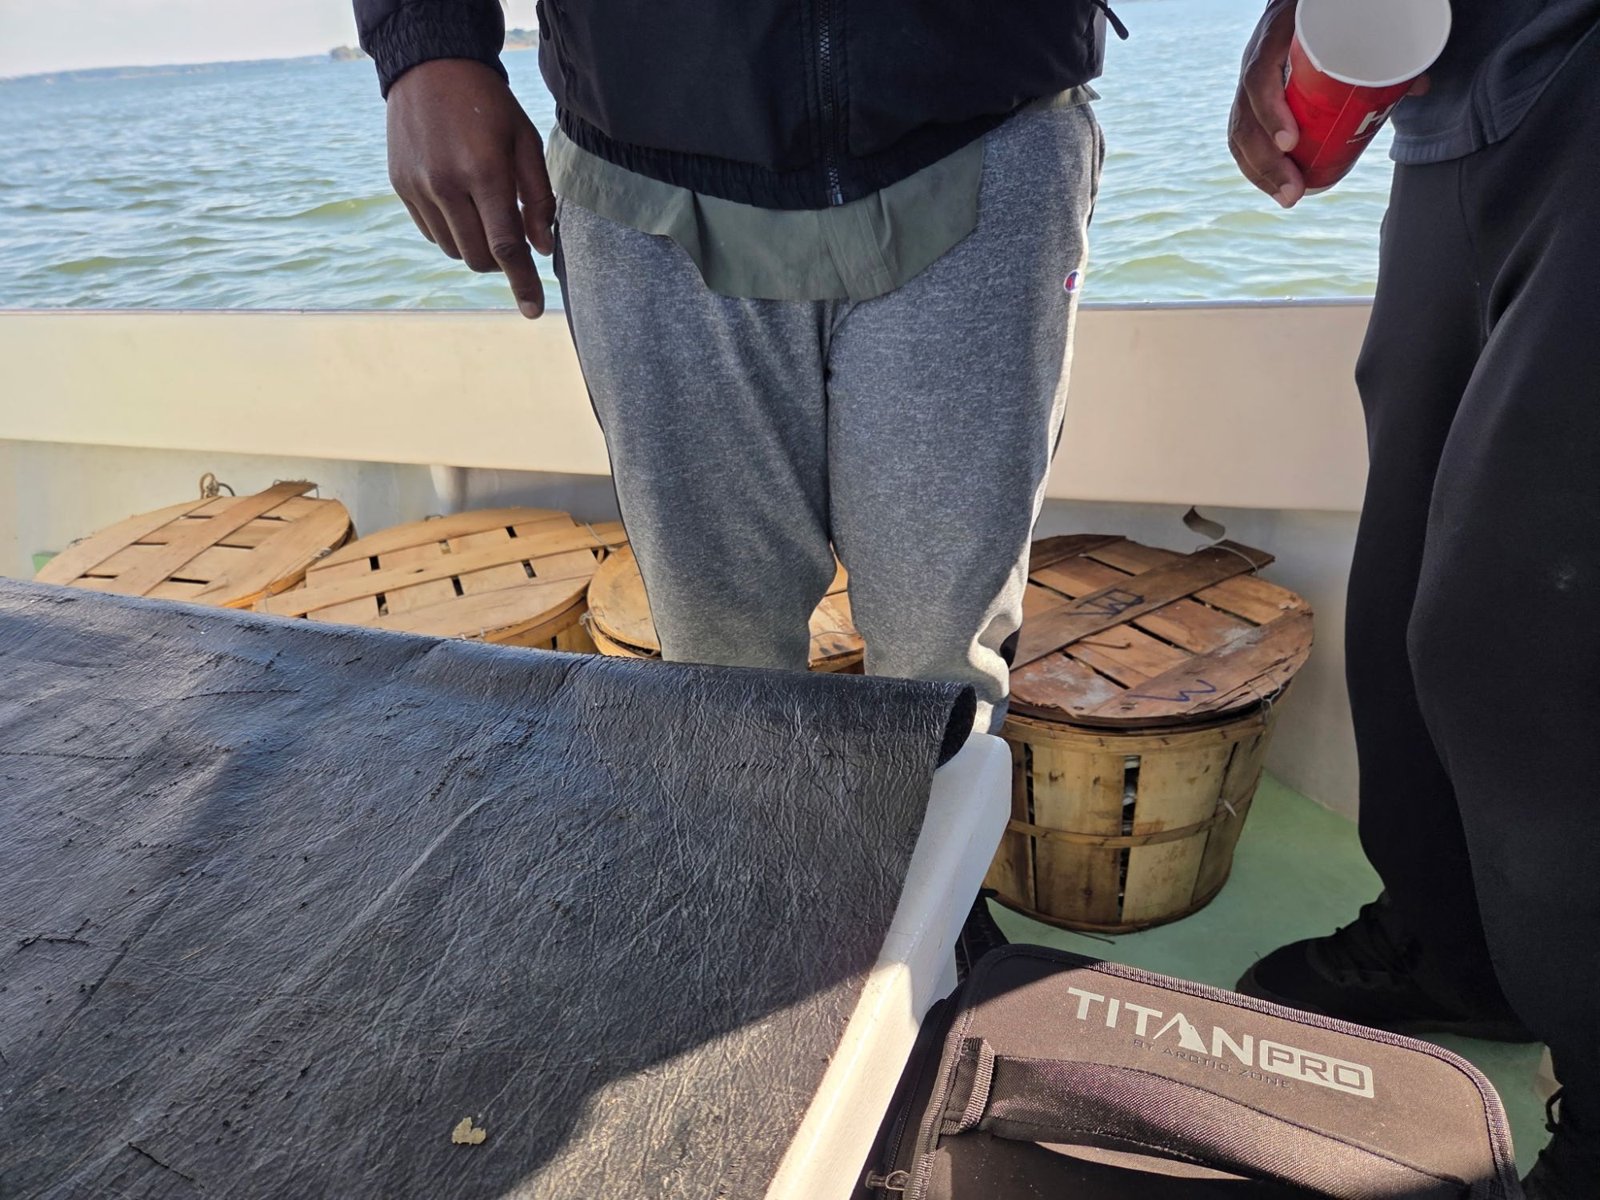
The 2026 winter survey counted about 349 million crabs, 46 percent more than last year. Juveniles jumped 121 percent to about 228 million after six straight years below average. Adult females fell 25 percent to about 81 million, above the safety threshold but under the target, and a hard winter killed about 20 percent of the adult males and 12 percent of the adult females, against averages of 9 and 7 percent.[8]
Grasses matter here. Maryland's underwater grasses grew nearly 13 percent in 2025 to 41,419 acres, about 36 percent of the state's goal, and the state's natural resources secretary says more grass means more habitat for blue crabs and fish.[9] A draft stock assessment found more crabs than earlier thought, and a decline overall with no clear cause.[8] So the grade and the survey both point up this year. They are different measurements, and neither proves the other.
The oyster bar
Maryland replants its oysters. Its Seed and Shell program puts young oysters on shell, wild seed and recycled shell onto public bars. In 2024 that was 462 million young oysters on shell and more than 230,000 bushels of recycled shell, and shell has become scarce and costly enough that the state used crushed concrete for the first time.[10] Oyster reproduction in 2025 was the second highest in the state's 41-year survey.[11]
Yet by January 2026 the harvest was running about 44 percent below the five-year average, and the dockside price of a bushel had fallen 66 percent. Maryland's congressional delegation cited an unseasonably cold winter with icy conditions, fishery closures after a Potomac River sewage spill, and a challenging market.[12] A Bay getting healthier and a bad year for the people who work the oyster bars happened in the same season.
The sailor
I sail, and I have sailed on the Bay. The report card does not measure boating, and I found no study of what a grade does to a sailing season. What the boating economy looks like: boaters and watersports have a $4.2 billion economic impact in Maryland and support 16,871 jobs, by the count of the state's marine trades association.[13]
What a sailor sees first is the water. The cloudier water and the algae trending worse in the report are the findings a crew will notice before any score.[4] In Virginia, red and brown tides recur in the lower York and James rivers and the lower Bay from July to October. The state says they have not been tied to human health effects but have been linked to fish kills and shellfish die-offs.[14]
In my reading, that is the split. Nitrogen, grasses and oxygen are what crabs and oysters feel. Clarity and algae are what a boat crew feels. The grade can rise while one of those improves and the other does not.
Annapolis
Annapolis is where the Bay's boating economy puts on its show. The powerboat show ran October 8 to 11 this year and the sailboat show October 15 to 18, on City Dock and in the harbor.[15][16] The report card came out between them, on October 13. The 2025 shows drew tens of thousands of visitors from all 50 states and more than 40 countries, and the city's share of the ticket revenue came to $564,320.[15]
The Naval Academy is in the same town, on the same water. Midshipmen began sailing there in a fleet of identical wooden yawls at the end of World War II. In 2014 the squadron was four 44-foot sail training vessels, used in an offshore program meant to build navigation, seamanship and small-unit leadership.[17] In my reading, that makes the Bay two things to two kinds of people in Annapolis: a showroom for the trade and a classroom for the Navy. Both depend on the same water, and neither shows up in the grade.
Baltimore
The Bay's biggest port sits on the Patapsco River, and a ship struck the Key Bridge there on March 26, 2024.[18] Crews cleared the last large section from the Fort McHenry channel in June 2024, and the Unified Command certified the channel at its original 700 feet wide and 50 feet deep on June 10.[19] The port recovered. Its terminals handled 2,223 cargo vessel visits in 2025, a record and 21 percent above 2024.[20]
The bridge has not recovered. The rebuild is forecast at $4.3 billion to $5.2 billion and to open in late 2030, against a first target of 2028.[21][22] Until then trucks and commuters go around. In the weeks after the collapse, University of Maryland data showed trips by trucks detouring around the Beltway or through the tunnels taking two to three times as long in some cases, and a federal motor carrier safety official described significant effects on I-95, I-895 and I-695.[23] I found no current measure of that detour. In my reading, that is the cost that stays. The ships get through, and the goods and the people on the road take longer to reach what the ships delivered.
What a grade is
A grade is a summary, and the people on the water feel the parts. The Bay got its best grade in 40 years, the crab survey rose, the oyster beds reproduced, and the watermen had a poor oyster year while the water got cloudier. A better Bay is real, and it is not yet a better year for everyone on it.
The scores, counts and prices are as the cited sources report them. The crab and oyster counts are survey estimates, the 2025 crab landings are preliminary, and the oyster harvest and price figures are from January 2026 data. The grade does not measure boating, crabs or oyster income, the Naval Academy fleet figure is from 2014, the truck travel-time figures are from the weeks after the collapse, and I found no data tying it to a sailing season. The readings of how the grade, the survey and the harvests relate are mine.
- UMCES Integration and Application Network, UMCES Integration and Application Network, 2026 Chesapeake Bay & Watershed Report Card
- Baltimore Fishbowl, Baltimore Fishbowl, "Chesapeake Bay earns best overall health grade in four decades"
- Axios Richmond, Axios Richmond, new Chesapeake Bay report card (Oct. 19, 2026)
- Chesapeake Bay Foundation, Chesapeake Bay Foundation, "Chesapeake Bay Earns High Marks in Report, but Trouble Spots Persist"
- The Baltimore Sun, The Baltimore Sun, "Chesapeake Bay is the healthiest it's been in 40 years — with a C+ grade" (Oct. 13, 2026)
- Maryland DNR, Maryland DNR, Commercial Blue Crab Landings
- Virginia, Virginia, 2025 Annual Report on the Blue Crab Fishery Management Plan (RD983)
- Maryland DNR, Maryland DNR, 2026 Chesapeake Bay Blue Crab Winter Dredge Survey (May 18, 2026)
- Maryland DNR, Maryland DNR, "Maryland's Chesapeake Bay underwater grasses expanded nearly 13% in 2025" (Sept. 8, 2026)
- Oyster Recovery Partnership, Oyster Recovery Partnership, "Rebuilding Public Oyster Grounds in 2024"
- WJLA, WJLA, "Maryland sees near-record oyster reproduction in 2025, officials say"
- Office of Rep. Steny Hoyer, Maryland congressional delegation, letter urging a federal fishery disaster declaration for oysters (Feb. 27, 2026)
- Maryland DNR, Maryland DNR, "Outdoor recreation industry provides $10.6 billion impact on Maryland economy" (Mar. 17, 2026)
- Virginia Department of Health, Virginia Department of Health, Harmful Algal Bloom FAQs
- Hoodline, Hoodline, "Dock and awe: 400 powerboats to pack Annapolis waterfront" (Aug. 2026)
- Yatco, Yatco, Annapolis Sailboat Show 2026
- U.S. Naval Academy, U.S. Naval Academy, "U.S. Naval Academy's sailing squadron to dock in Charleston" (June 2014)
- Congressional Research Service, Congressional Research Service, "Baltimore Bridge Collapse: Frequently Asked Questions"
- gCaptain, gCaptain, Baltimore bridge update: salvage and wreck removal
- Maryland Governor's Office, Maryland Governor's Office, "Governor Moore Announces New Port of Baltimore Records" (Jan. 2026)
- The Baltimore Sun, The Baltimore Sun, "Key Bridge rebuild projected to cost billions more and take until 2030 to complete" (Nov. 17, 2025)
- The Dundalk Eagle, The Dundalk Eagle, "MDTA details updates on Key Bridge restoration and timeline"
- CBS Baltimore, CBS Baltimore, "Steady progress in Key Bridge salvage and recovery operations; significant increase in travel times for trucks" (Apr. 14, 2024)
- WMAR 2 News, Chesapeake Bay earns a C in its latest report card, marking its highest overall score in 40 years of tracking