The Unemployment Rate Was 4.2 Percent in September. It Is Standing on Seven Choices, Starting With a Survey of 60,000 Households.
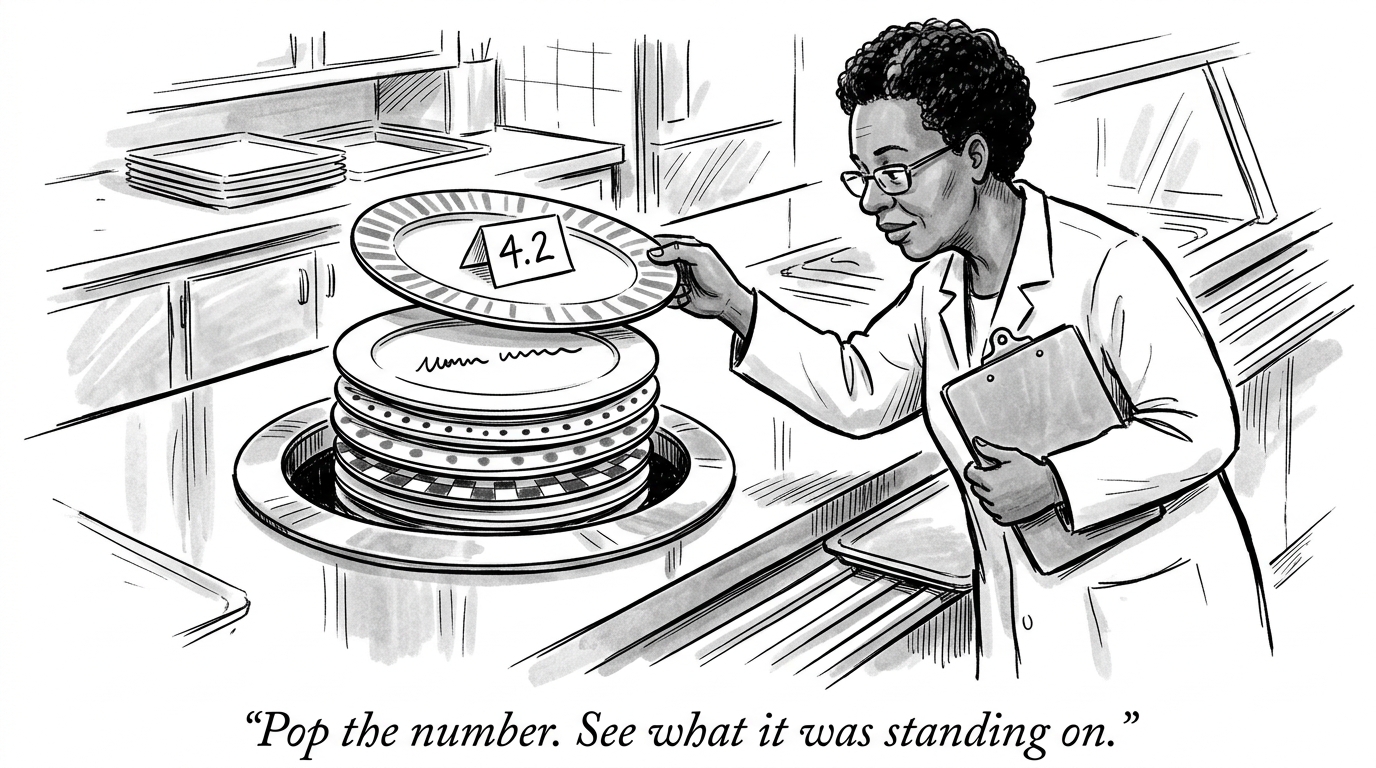
The Bureau of Labor Statistics reported on October 2, 2026 that the unemployment rate for September was 4.2 percent, with 7.1 million people unemployed, and that both figures "changed little."[1] That sentence is true. It also stands on seven things, and every one of them is a choice someone made.
None of this is a flaw. A national number has to be built from something, and the building is mostly careful. The point is that a number is a conclusion, and the question worth asking of any conclusion is what it stands on.
1. A survey, run by a different agency than the one that reports it
The unemployment rate comes from the Current Population Survey, which is "conducted by the U.S. Census Bureau for the U.S. Bureau of Labor Statistics."[2] Census Bureau employees contact the households, and BLS publishes the result.[3] The number you hear in the news is the end of a chain between two federal agencies.
2. A sample of about 60,000 households
It is "a sample survey of about 60,000 eligible households" a month.[2] BLS's methods handbook, last updated in 2018, says interviews are completed for about 54,000 housing units and that information is obtained on about 105,000 people ages 16 and older each month.[4] The country is divided into 1,987 areas from which housing units are drawn.[4] A household is in the survey for four consecutive months, leaves for the following eight, and returns for four more, so about 75 percent of the sample is common from one month to the next.[4]
3. Roughly two of every three households that are asked, answer
The share of eligible households that completed the survey was 64.3 percent in January 2026 and 65.9 percent in February 2026, the latest months BLS has posted.[5] BLS says response rates "have declined from the low 90 percent range to the upper 60 percent range over the last 15 years."[6] A rate in the mid-60s does not make the survey wrong. It means the people who answer are weighted, as step 6 describes, to stand in for the people who do not.
4. One week, chosen in advance
Everyone is asked about "generally the calendar week that contains the 12th day of the month."[2] A person who finds a job on the 20th is still counted as they were in the week of the 12th.
5. A four-week rule
To be counted as unemployed, a person must be not working, "available for work during the survey reference week, except for temporary illness," and have made "at least one specific, active effort to find a job during the 4-week period ending with the survey reference week."[7] A person who is temporarily laid off and expecting to be recalled is also counted.[7] Someone who wants a job and has not searched in the last four weeks is not unemployed by this definition. BLS counts such a person as outside the labor force and, if they looked for a job at some point in the prior 12 months, as "marginally attached."[7][1]
This is why there is more than one rate. The headline, called U-3, was 4.2 percent in September. A broader measure, U-6, which adds all people marginally attached and people employed part time for economic reasons, was 7.6 percent.[8] Both are accurate. They answer different questions.
6. Weights, reset every January
The sample is weighted to independent population controls, estimates of the civilian noninstitutional population ages 16 and older.[9] "BLS incorporates the annual population control adjustments into the CPS estimates with data for January."[10] In 2026, BLS announced that January estimates would be revised to incorporate updated controls with the release of February data on March 6.[11]
7. A seasonal adjustment
The 4.2 percent is "seasonally adjusted." BLS describes this as "a statistical procedure used to remove seasonal fluctuations from data series."[10] BLS has used the X-13ARIMA-SEATS program since 2015 and reruns it each month as new data arrive.[12] The unadjusted rate for September was 4.0 percent.[8]
And the number has an error bar
BLS states it directly: at an unemployment rate of around 6.0 percent, the 90-percent confidence interval for the monthly change in the rate "is about +/- 0.3 percentage point."[2] That is why a move from 4.1 percent in August to 4.2 percent in September is described as "changed little."[8][1] A tenth of a point is inside what the method can tell apart from nothing.
The phone wrinkle: many survey methods were built for a landline
The unemployment survey does not depend on a telephone number. It draws housing units from geographic areas, and its interviews are "live interviews conducted either in person or over the phone."[3] A poll is different. For decades the standard poll dialed random landline numbers, because a landline belonged to a household and a household belonged to a place. In the second half of 2009, about 22.9 percent of U.S. adults lived in households with only wireless telephones.[13] By the second half of 2024, the National Center for Health Statistics put the figure at 78.7 percent.[14] NCHS itself noted the concern that random-digit-dial health surveys "could have been biased" if they did not include enough wireless-only households.[14]
A cellphone brings problems a landline did not. "Unlike a landline phone, a cellphone is assumed in Pew Research polls to be a personal device," so the unit is a person, not a household.[15] Americans who have a cellphone but not a landline are, in Pew's words, "disproportionately young and nonwhite," and "when people move, they can take their cellphone numbers with them."[16] And fewer people answer at all: Pew says response rates to telephone surveys "have plummeted in recent decades," and it now does the vast majority of its U.S. polling online, recruited mostly by mailing printed invitations to addresses drawn from a U.S. Postal Service file.[17]
The author's household shows how far the number and the home have come apart. One phone carries a 703 number, an area code for Northern Virginia, and its owner lives in Virginia now but kept the same number through years in New Jersey and New York.[18] Another carries a 908 number, which the numbering plan assigns to northern New Jersey, with certain mobile phones in Monmouth and Ocean counties. It was registered in Toms River, in Ocean County, and its owner lives in Virginia.[19] A parent's phone carries a 609 number, central and southern New Jersey, and the parent lives in Florida.[20] Three phones, and today only one area code matches where its owner is. A landline was a household at an address, so dialing it reached a home. A mobile number is a person, and it records where that person once signed up. A sample drawn from area codes would place two of the three in the wrong state, and would have placed the third in the wrong state for years.
None of this makes polls wrong. Pollsters have adapted, and NPR's senior political editor, Domenico Montanaro, described the current standard on All Things Considered: high-quality polls try to reach people "not just on land lines or cell phones," but by text and online as well, and they publish their methodology.[21] He called a missing methodology "a major red flag."[21] He also said polls are snapshots of the moment they were conducted, not predictions, and that state polling is much lower quality than national polling.[21] A poll is a choice about who is reachable, how they are reached and how the gap is weighted. It is the same stack with a different bottom layer, and the pollster who tells you which choices were made is doing what BLS does.
A hole, honestly marked
There is no figure for October 2025. "CPS data were not collected for October 2025 due to the lapse in appropriations and were not collected retroactively."[22] BLS says plainly that there are no CPS estimates for that month and that the 2025 annual averages use the 11 months of available data and are "not strictly comparable with annual averages for other years."[22] The bureau did not fill the gap with a guess. It left the gap and said so.
Why does this matter?
A reader who knows what the 4.2 stands on can do something a reader of the headline cannot. They can tell a real change from noise. They know which people the number does not count, and which other number does. They know that the people who built it published all of this, in plain language, on the same website as the result.
The habit is portable. Before you accept any figure, a poll, a growth rate, a price index, a crime rate, ask four things: who counted, how many, what counted as a case, and what was adjusted. The answers are almost always published. The number is only the top of the stack.
Part of a longer argument about what numbers and dinners stand on. See also DoAyni's piece on what your dinner stands on.
- U.S. Bureau of Labor Statistics, The Employment Situation — September 2026, news release (Oct 2, 2026)
- U.S. Bureau of Labor Statistics, The Employment Situation — Technical Note (Oct 2, 2026)
- U.S. Bureau of Labor Statistics, How the Government Measures Unemployment
- U.S. Bureau of Labor Statistics, Handbook of Methods, Current Population Survey: Design (last modified April 10, 2018)
- U.S. Bureau of Labor Statistics, Household Survey Response Rates
- U.S. Bureau of Labor Statistics, Report to the Appropriations Committees on Modernizing the Current Population Survey (April 2026)
- U.S. Bureau of Labor Statistics, CPS Definitions
- U.S. Bureau of Labor Statistics, Table A-15. Alternative measures of labor underutilization (September 2026)
- U.S. Bureau of Labor Statistics, Handbook of Methods, Current Population Survey: Calculation
- U.S. Bureau of Labor Statistics, CPS Documentation
- U.S. Bureau of Labor Statistics, CPS notices: January 2026 estimates revised with updated population controls (Feb 27, 2026)
- U.S. Bureau of Labor Statistics, Seasonal Adjustment Methodology in the CPS
- National Center for Health Statistics, CDC, Wireless Substitution: Early Release of Estimates From the National Health Interview Survey, July–December 2009 (May 2010)
- National Center for Health Statistics, CDC, Wireless Substitution: Early Release of Estimates From the National Health Interview Survey, July–December 2024 (June 2025)
- Pew Research Center, Appendix 3: About the Surveys, Beyond Red vs. Blue: The Political Typology (June 26, 2014)
- Pew Research Center, Flashpoints in polling (Aug 1, 2016)
- Pew Research Center, How do people in the U.S. take Pew Research Center surveys, anyway? (June 26, 2024)
- Wikipedia, Area codes 703 and 571
- Wikipedia, Area code 908 (northern New Jersey; certain mobile phones in Monmouth and Ocean counties)
- Wikipedia, Area codes 609 and 640
- NPR, All Things Considered, Political polls are everywhere, how much can they predict about November? (Oct 9, 2026)
- U.S. Bureau of Labor Statistics, Impact of the 2025 Federal Government Shutdown on the CPS