Your Dinner Is Standing on Five Things You Have Never Had to Look At. One of Them Is a Waterway About 21 Miles Wide.
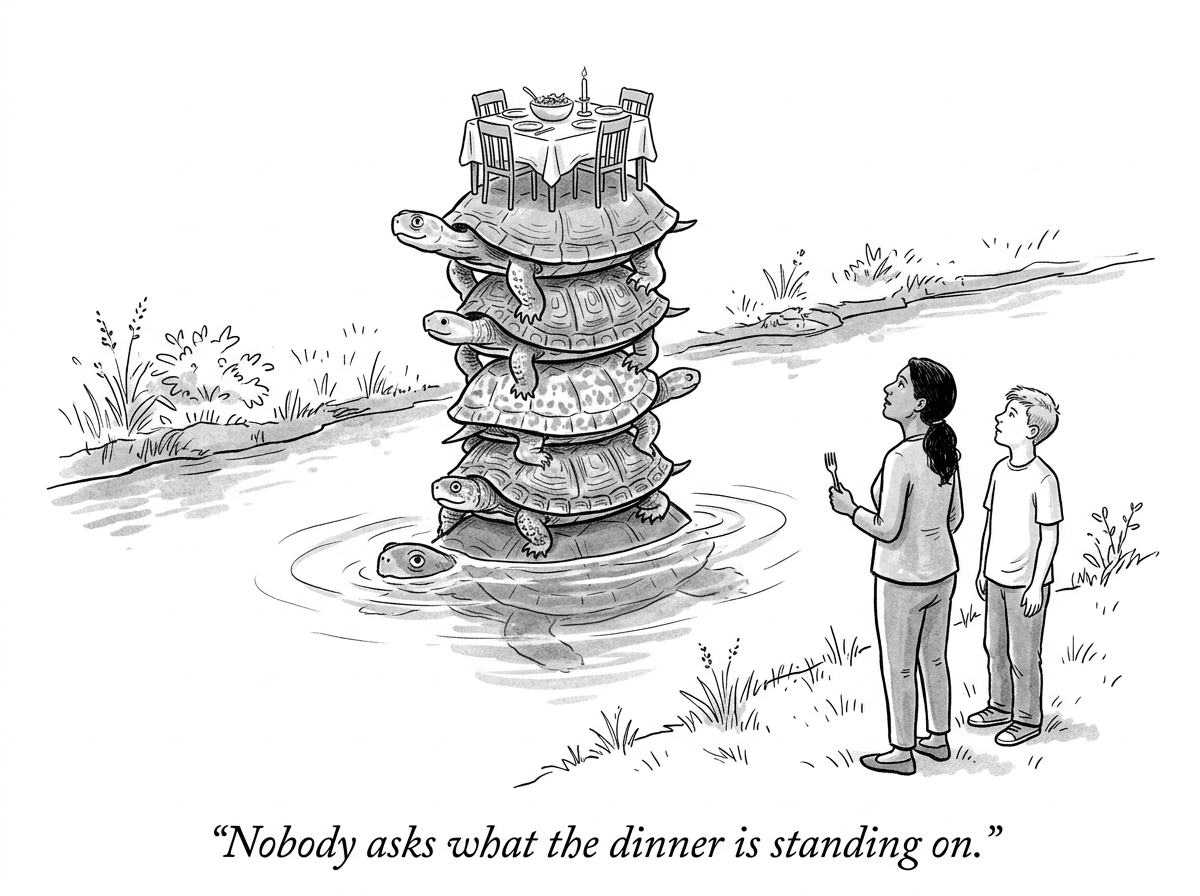
The plate on the table is the top of a stack: the grocery shelf rests on a farm, the farm on fertilizer, the fertilizer on natural gas and ships, and the ships on a waterway about 21 miles wide at its narrowest.[1] Most of the time no one has to know. In 2026 the lowest layer you can see from a kitchen has been in the news, and the food price index has been listening.[2]
This piece takes the stack one layer at a time, from the top. It takes no side in the war that disrupted the strait or in any trade dispute. It describes what the physical chain is made of, because that is the part of the story that reaches a kitchen.
The shelf What a store sells in a given week was grown, picked and trucked months earlier by someone who bought inputs before the season began. The shelf price is the end of a decision that was made on a farm.
The farm About half the people on Earth are fed by crops grown with synthetic nitrogen fertilizer. Our World in Data, summarizing a 2008 Nature Geoscience study, puts the figure at 48 percent of the global population in 2008, up from 44 percent in 2000.[3] Take the fertilizer away and the harvest does not shrink a little. It shrinks by the part of it that nitrogen made possible.
The fertilizer Nitrogen fertilizer is made from natural gas. In the United States, gas is "on average 60-70pc of total production costs at current prices," according to Argus Media in May 2024.[4] Phosphate fertilizer needs sulfur, and the farmdoc analysis puts roughly 44 percent of seaborne sulfur through the strait.[5] So the plant that makes the fertilizer has two exposures: the price of gas, and a supply of sulfur that crosses one narrow waterway.
The ship A great deal of that fertilizer travels by water, and a large share of it leaves one region. Researchers at the International Food Policy Research Institute estimate that the Strait of Hormuz carried up to 30 percent of global fertilizer shipments in 2024.[6] The University of Illinois's farmdoc daily wrote on April 29 that "the Persian Gulf normally accounts for about 40% of globally traded urea exports."[5]
The strait The strait carries about 20 million barrels of oil a day, "the equivalent of about 20% of global petroleum liquids consumption," and about a fifth of the world's liquefied natural gas, mostly from Qatar.[7][8] It is about 21 miles wide at its narrowest, and ships use an inbound and an outbound lane each about two miles wide, separated by a buffer of about the same width.[1] There are pipelines that go around it, but the U.S. Energy Information Administration counted only about 3.5 million barrels a day of unused bypass capacity, against roughly 20 million through the strait.[9]
The strait is where this chain meets the news, so it is where this piece stops. It is not the bottom. The lanes stay open because of agreements, navies and budgets that are themselves standing on other things, and those on others still. Look under any layer and there is another one. There is no bottom. Every floor you reach turns out to be a layer.
What happened when a lower layer moved On February 27, 2026, the day before the strikes that began the war, urea at New Orleans cost about $470 a short ton.[5] The World Bank reported that its fertilizer price index rose more than 12 percent in the first quarter of 2026, that the increases were "most pronounced for urea," and that the index is projected to rise more than 30 percent over the year.[10]
The farm bill arrives later. The U.S. Department of Agriculture's Economic Research Service forecast that U.S. farmers' spending on fertilizer, lime and soil conditioners would rise $5.3 billion, or 15.3 percent, in 2026.[11] And the grocery bill follows the farm bill. The Food and Agriculture Organization's September food price index was 136.0, up 5.8 percent from a year earlier. The agency said "uncertainty over shipping through the Strait of Hormuz kept concerns about fuel, fertilizer and freight costs elevated."[2]
How exposed is the United States? Less than the headline suggests, and more than the average shopper would guess. By one University of Illinois analysis, imported nitrogen was about 13 percent of U.S. nitrogen consumption in 2025.[6] That leaves most of the nitrogen the country uses made at home, but it is still bought and sold at a world price, and a world price does not care where the bag was filled.
Potash is the other leg, and it runs through a trade policy Crops need potassium as much as nitrogen, and USGS says no substitute exists.[12] The United States makes about 0.5 million tons of potash a year and imports about 5.6 million, so it relied on imports for 92 percent of what it used in 2025, by USGS's estimate.[12] From 2021 to 2024, 79 percent of those imports came from Canada, 12 percent from Russia and 3 percent from Israel.[12] Canada produced about 31 percent of world output in 2025, and all ten of its active potash mines are in Saskatchewan.[12][13]
Nitrogen is exposed through a war. Potash is exposed through a tariff schedule. From March 7, 2025, Canadian potash that did not qualify under the U.S.-Mexico-Canada agreement paid a 10 percent duty, and qualifying potash paid none.[14] Those emergency-law duties ended in February 2026 after the Supreme Court ruled that the statute did not authorize tariffs.[15] Illinois potash held between $490 and $505 a ton through August 2026, 2.5 percent above a year earlier.[16] In late August, Canada's premiers were arguing over whether to use potash as leverage, and Saskatchewan's premier opposed export taxes on it, calling them a tremendous economic hit to his province.[17]
None of this is a prediction. Prices have moved up and down this year, and they may move again. The point is not the level of the number this month. It is that the number is connected to a waterway and a tariff schedule most buyers have never seen.
Why does this matter? A stack that works is invisible, and a stack that is invisible gets no one's attention until a layer moves. The picture on this page has a turtle at the bottom with its shell under the water and only its head showing, and that is the honest version of the story: there is no foundation to stand on, only more layers. The question is not what the dinner finally stands on, because there is no bottom to find. Nothing is the floor.
What follows from that is smaller and more useful. The right question, for a household or a government, is not "why did groceries go up." It is which layers of the stack are ours to strengthen, which are shared with a country we do not control, and whether each one is built so that whoever stands on it next can see where it gives.
Part of a longer argument about the layers under things that look solid. See also DoAyni's earlier piece on the Strait of Hormuz, and on the CIA's investment arm and the Pentagon's.
- U.S. Institute of Peace, The Iran Primer, Key Facts on Strait of Hormuz
- Food and Agriculture Organization of the United Nations, FAO Food Price Index, September 2026 release (Oct 2, 2026)
- Our World in Data (Hannah Ritchie), citing Erisman et al., Nature Geoscience, 2008, How many people does synthetic fertilizer feed?
- Argus Media, Low US natgas prices help ammonia economics (May 8, 2024)
- farmdoc daily, University of Illinois, Strait of Hormuz disruption scenarios and fertilizer purchasing risks for U.S. crop producers (Apr 29, 2026)
- farmdoc daily, University of Illinois, Middle East conflict revives concerns over fertilizer dependence in the U.S. and Brazil (Apr 20, 2026)
- U.S. Energy Information Administration, Strait of Hormuz oil flows, Today in Energy (Jun 16, 2025)
- U.S. Energy Information Administration, Strait of Hormuz LNG flows, Today in Energy (Jun 24, 2025)
- U.S. Energy Information Administration, Bypass capacity around the Strait of Hormuz, Today in Energy (Nov 21, 2023)
- World Bank, Development Talk, The Commodity Markets Outlook in eight charts (Apr 30, 2026)
- USDA Economic Research Service, Farm Sector Income Forecast, updated Sep 3, 2026
- U.S. Geological Survey, Mineral Commodity Summaries 2026: Potash
- Natural Resources Canada, Potash Facts (modified Jan 29, 2026)
- Federal Register, Executive Order 14231, Amendment to Duties To Address the Flow of Illicit Drugs Across Our Northern Border, sec. 2, 90 Fed. Reg. 11785 (Mar 11, 2025)
- Federal Register, Executive Order 14389, Ending Certain Tariff Actions, 91 Fed. Reg. 9437 (Feb 25, 2026)
- farmdoc daily, University of Illinois, Fertilizer and fuel prices higher heading into fall 2026 (Aug 11, 2026)
- Canadian Press (via CP24), Premiers at odds over leveraging potash in Canada's trade war with U.S. (Aug 28, 2026)